Business Development KPI Dashboard

Business Development KPI Dashboard

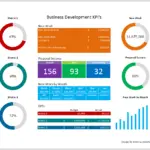
Business development and sales are two different ideas. However, they both generally lead to a similar outcome – revenue growth. Regardless of which concept you or your business chooses to focus on, results must be tracked and evaluated. This template can help. It’s a Business Development KPI

Read more

Excel Thermometer Charts

thermometer charts

Excel thermometer Charts can really add visual appeal to an existing dashboard or be used as a standalone graph. Below are four that we’ve created providing several options and showing the versatility of an Excel thermometer chart. All charts are fully functional, meaning the thermometer “fills” based

Read more

Speedometer Chart

speedometer chart

Excel Speedometer (Speedo) Charts can add visual appeal to an existing dashboard or be used as a stand-alone graph. Below are four that we’ve created providing several options and showing the versatility of an Excel Speedometer Chart. All charts are fully functional, meaning the needle moves based

Read more