Excel thermometer charts can add visual appeal to an existing dashboard or be used as a standalone graph. The Excel thermometer chart with arrows is simple with clean lines, and easy to use. Below are seven that we’ve created providing several color options. All charts are fully functional,
Read more →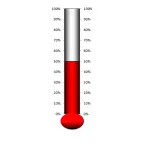
Excel thermometer charts can add visual appeal to an existing dashboard or be used as a standalone graph. The Excel thermometer chart with circle base is simple with clean lines, and easy to use. Below are seven that we’ve created providing several color options. All charts are
Read more →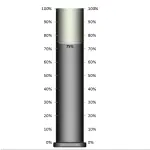
Excel thermometer charts can add visual appeal to an existing dashboard or be used as a standalone graph. The Excel thermometer chart with base is simple with clean lines, and easy to use. Below are seven that we’ve created providing several color options. All charts are fully
Read more →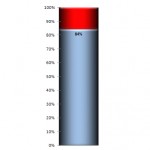
Excel thermometer charts can really add visual appeal to an existing dashboard or be used as a standalone graph. The basic Excel thermometer chart is simple with clean lines, and easy to use. Below are seven that we’ve created providing several color options. All charts are fully
Read more →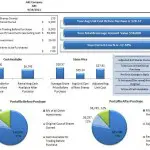
An incremental purchase or sale of an investment can impact your average basis. The basis is your average cost of the original investment. For tax purposes, the method of computing the gain or loss on investments must be elected and consistently applied. This spreadsheet does not track
Read more →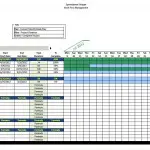
The Gantt Chart found here is designed to work in any version of Excel from 2003 forward. People commonly use Gantt Charts to plan and manage projects. There are several Gantt Chart options available from very simple to quite complex. This chart is somewhere in between. It’s
Read more →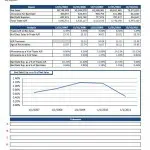
Analyze and evaluate accounts receivable over a 5 year period with this tool. All information can be reviewed graphically over time to provide additional context. Eight key ratios are calculated off of a few inputs. These ratios include Days Sales in Trade AR, AR Turnover, and Bad
Read more →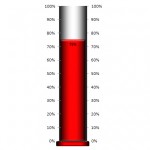
Excel thermometer Charts can really add visual appeal to an existing dashboard or be used as a standalone graph. Below are four that we’ve created providing several options and showing the versatility of an Excel thermometer chart. All charts are fully functional, meaning the thermometer “fills” based
Read more →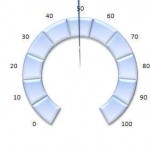
Excel Speedometer (Speedo) Charts can add visual appeal to an existing dashboard or be used as a stand-alone graph. Below are four that we’ve created providing several options and showing the versatility of an Excel Speedometer Chart. All charts are fully functional, meaning the needle moves based
Read more →Want to know how to make thermometer chart in Excel? We’ll show you how to do this quickly and easily, so you can follow along and create your own. How to make an Excel thermometer chart Step 1 It’s always good to plan ahead. Before starting, determine
Read more →